Troubleshoot Kubernetes Deployments: A Practical Guide
Learn how AI can help troubleshoot Kubernetes deployment issues efficiently, reducing downtime and enhancing operational efficiency with actionable insights.
Kubernetes environments are inherently complex and dynamic distributed systems. This complexity can make troubleshooting issues a daunting task, often requiring deep expertise.
As companies scale their Kubernetes deployments, they often encounter an increasing frequency and variety of issues. Common problems such as CrashLoopBackOff, ImagePullBackOff, and nodes reporting a NotReady status can significantly disrupt service delivery and negatively impact user experience. Addressing these issues promptly is crucial for maintaining operational efficiency and ensuring a seamless experience for end users on the Kubernetes-powered platform.
Troubleshooting Kubernetes deployments can be a real pain. Sifting through logs and tracing requests across microservices gets complicated fast. Traditional debugging methods simply don't scale. This post explores common Kubernetes issues, explains why they're so tricky, and shows how Plural's AI-powered troubleshooting can help. We'll cover how to simplify debugging, resolve problems faster, and ultimately improve uptime.
Why is Kubernetes Troubleshooting So Hard?
Managing Kubernetes at scale is a daunting task, often requiring a specialized team of DevOps and Site Reliability Engineers (SREs)—a resource that is frequently in short supply.
As the Kubernetes environment scales, the interconnected components—such as Pods, Deployments, Services, Ingress, and more—introduce significant complexity. Troubleshooting issues within this ecosystem involves navigating a maze of YAML configurations, logs, and ambiguous error messages.
Many companies go through the following common pain points when operating Kubernetes at scale:
Key Takeaways
- Kubernetes complexity hinders troubleshooting: Unclear error messages, complex configurations, and the steep learning curve make troubleshooting Kubernetes difficult, leading to downtime and wasted engineering time.
- Manual troubleshooting doesn't scale: CLI commands and existing tools often lack the contextual awareness to effectively diagnose and resolve issues in large, complex deployments.
- Plural's AI-driven approach offers a solution: Plural leverages AI to automate issue detection, analyze errors, suggest fixes, and provide interactive guidance, simplifying Kubernetes troubleshooting and improving operational efficiency.
Unclear Error Messages
Troubleshooting Kubernetes often involves dealing with dense, low-level information that can leave even experienced DevOps engineers guessing. For instance, a vague CrashLoopBackOff status could indicate anything from app configuration errors, resources issues, application bugs or microservices dependency failures. An example would be when a pod enters a CrashLoopBackOff state due to insufficient memory, but the error message doesn’t specify whether it's a resource limit issue or a problem with the application itself, making it difficult to quickly identify the root cause.
Tools like Terraform, essential for managing infrastructure alongside Kubernetes, can add another layer of complexity. Terraform often outputs verbose, raw cloud provider errors that provide little actionable guidance, making it harder to connect infrastructure issues with Kubernetes-specific problems.
Complex Kubernetes Configurations
As Kubernetes environments scale, the complexity of configurations grows exponentially. YAML manifests define the desired state of Kubernetes, but even a single misplaced line can lead to deployment failures or unexpected behavior. For example, an incorrect indentation in a ConfigMap or a missing label in a Deployment manifest can cause pods to fail to start or services to be unreachable. As infrastructure complexity increases, pinpointing these misconfiguration issues can feel like searching for a needle in a haystack.
Steep Learning Curve
Kubernetes troubleshooting is intimidating for junior DevOps engineers, which means that teams often rely on senior staff to resolve issues. However, engineers with extensive experience with Kubernetes are in short supply, and if a senior engineer leaves without properly documenting operational procedures, the team may struggle to troubleshoot issues on their own.
Too Many Layers of Abstraction
Kubernetes operates on multiple layers—Pods, Deployments, Services, Ingresses, and more—each relying on the other. Issues in one layer can quickly affect others, complicating root cause analysis (RCA) and potentially leading to prolonged remediation times. For example, a misconfigured Ingress resource can prevent traffic from reaching the correct Service, which in turn affects the Pods running the application. Similarly, a Deployment issue could lead to Pods being stuck in a pending state, causing the associated Service to fail in routing traffic, even if the underlying network is fine.
What Happens When You Ignore These Challenges?
The challenges associated with Kubernetes troubleshooting directly impact the businesses that rely on these platforms, often leading to undesirable outcomes:
- Downtime and revenue loss: Extended system outages can severely affect customer satisfaction, resulting in lost revenue and damage to brand reputation. For example, an unresolved service outage could lead to customers being unable to access critical features, causing a drop in usage or even churn.
- Wasted engineering hours: Teams may spend valuable time manually interpreting logs, events, and configurations rather than focusing on strategic initiatives like improving product features or scaling the infrastructure. For instance, time spent debugging obscure error messages or identifying misconfigured manifests can delay important projects.
- Talent bottlenecks: Dependence on senior engineers for troubleshooting creates strain on your most skilled team members, leading to burnout and extended resolution times. A senior engineer might spend hours fixing a misconfiguration that a junior engineer could have resolved with proper documentation or tooling.
Why Traditional Kubernetes Troubleshooting Doesn't Scale
DevOps teams managing Kubernetes currently mostly rely on various DevOps toolchains and manual processes to troubleshoot Kubernetes.
Most cloud provider UIs (like the GCP UI) offer only surface-level insights into Kubernetes resources, so in order to sift through Kubernetes events, logs, and Terraform outputs to diagnose issues, they need to rely on CLI commands and custom scripts.
If they’re a little luckier, they might use something like ArgoCD, which is great for managing deployments but lacks rich diagnostic capabilities for troubleshooting more intricate issues. A common scenario is when ArgoCD shows a deployment error without offering useful insights into the root cause, forcing engineers to manually inspect logs or manifests for deeper understanding.
For example, below are some of the most frequent errors seen on Kubernetes environments, their causes, and how teams attempt to resolve them manually.
Troubleshooting Image Pull Failures
Image pull failures occur when Kubernetes cannot retrieve a container image from the specified registry. These issues disrupt pod initialization and can arise from a variety of reasons.
Common causes include:
- The image name or tag is incorrect, leading Kubernetes to search for a non-existent image.
- Authentication or permission issues prevent access to a private container registry.
- Network connectivity problems block communication between the Kubernetes cluster and the registry.
- Resource constraints on the node hinder image download or extraction.
Troubleshooting steps involve:
- Confirm the image name and tag in your deployment or pod specifications.
- Check the registry for the image’s existence using tools like Docker Hub or private registry dashboards.
- Manually pull the image using docker pull to verify connectivity and authentication credentials.
- Ensure the Kubernetes node has sufficient resources (storage).
Checking Image Name and Tag
One of the most common causes of ImagePullBackOff errors is a typo in the image name or tag within your Kubernetes manifests. It’s easy to accidentally specify the wrong image, especially when working with multiple images or complex deployments. For example, imagine you intend to use my-private-registry.com/my-app:v1.0 but accidentally write my-private-registry.com/my-app:v1.o (using the letter “o” instead of the number “0”). Kubernetes will search for the incorrect image, resulting in a pull failure. Always double-check the image name and tag in your YAML files against your intended image. If you’re using a private registry, ensure the registry URL is also correct.
Verifying Registry Authentication
If your image resides in a private container registry like Docker Hub, Amazon ECR, or Google Container Registry (GCR), authentication is crucial. Kubernetes needs the correct credentials to pull the image. A common mistake is misconfigured or missing secrets. Secrets in Kubernetes store sensitive information, such as registry login credentials. If the secret containing your registry credentials isn’t correctly linked to your service account, or if the credentials themselves are incorrect, the image pull will fail. You can verify authentication by trying to log in to your registry using the credentials stored in the secret. Tools like kubectl describe secret <secret-name> can help you inspect the secret’s contents. Be careful, as it contains sensitive data. If you’re using a cloud provider’s managed registry, ensure that your Kubernetes service account has the necessary Workload Identity or IAM roles for service accounts configured.
Using `docker pull` to Test Locally
Sometimes, the issue isn’t with your Kubernetes configuration but with network connectivity or your local Docker setup. A quick way to isolate the problem is to attempt to pull the image locally using the docker pull command. This helps determine whether the issue is within your Kubernetes cluster or external to it. For example, run docker pull my-private-registry.com/my-app:v1.0 from your local machine, ensuring your local Docker daemon is configured to use the correct credentials for your private registry, if applicable. If the pull fails locally, you know the problem lies outside of your Kubernetes cluster. This could be due to network connectivity issues, incorrect local credentials, or problems with the registry itself. If the local pull succeeds, the issue likely resides within your Kubernetes cluster’s configuration or network setup. This narrows down your troubleshooting scope. Remember, when using a private registry, you’ll need to log in to the registry using docker login before attempting the pull.
Troubleshooting Kubernetes Configuration Errors
Kubernetes relies heavily on YAML configuration files, making typos and misconfigurations a common issue. These errors can prevent resources from being created or functioning correctly.
Common causes include:
- Typo or syntax errors in YAML files disrupt the deployment process.
- Mismatched API versions create compatibility issues between configurations and the Kubernetes cluster.
- Incomplete or incorrect resource definitions, such as missing required fields or invalid arguments, cause failures.
Troubleshooting steps involve:
- Use
kubectl apply --dry-run=clientto validate the YAML file before applying it to the cluster. - Employ YAML linting tools to identify and correct syntax errors.
- Cross-check the API version and resource specifications against Kubernetes documentation.
- Review all environment variables and command-line arguments to ensure they align with application requirements.
Matching Ports and Labels: containerPort, targetPort, port, and servicePort
One common source of confusion and errors in Kubernetes arises from mismatched ports and labels between Pods, Services, and Ingresses. For a service to correctly route traffic to your application, several port configurations need to align. The containerPort in your Pod definition specifies the port your application listens on within the container. The Service that exposes this Pod needs a targetPort that matches this containerPort, ensuring that incoming traffic is directed to the application. The Service also has a port, which it exposes to the cluster. If you're using an Ingress for external access, its servicePort must match the Service's port. Mismatches can lead to connection failures or misrouted traffic. LearnK8s’ guide on troubleshooting deployments offers a helpful visual explanation of this.
Service Selectors and Pod Labels
Services use selectors, key-value pairs, to identify and route traffic to the correct Pods. These selectors must match the labels assigned to the target Pods. It's like tagging Pods with attributes and then instructing Services which Pods to include based on those tags. If your Service selector and Pod labels don't match, the Service can't find the Pods, making your application unavailable. A simple typo can cause this. Verify targeting by checking the Service's Endpoints, which list the IPs and ports of the discovered Pods. An empty or incorrect Endpoints list signals a selector or label problem. Understanding the relationship between Pods, Services, and Ingress is crucial for effective troubleshooting, as emphasized in various Kubernetes debugging guides. When using tools like Argo CD and encountering deployment errors, checking these labels and selectors is a good first step.
Troubleshooting Permission Issues in Kubernetes
Kubernetes enforces access control policies through Role-Based Access Control (RBAC) and other mechanisms. Permission issues often lead to failed resource access or operations.
Common causes include:
- Insufficient permissions assigned to the service account used by an application or pod.
- Misconfigured RBAC roles or bindings prevent proper resource access.
- Security context constraints restrict specific actions at the cluster or namespace level.
Troubleshooting steps involve:
- Use
kubectl auth can-icommand to verify the service account’s permissions for specific operations. - Inspect RBAC roles, role bindings, and cluster role bindings for misconfigurations.
- Modify security contexts and constraints if necessary, ensuring compliance with your organization’s security policies.
Troubleshooting Kubernetes API Call Failures
Applications and Kubernetes core components frequently communicate via the Kubernetes API server. Failures in these REST API calls can disrupt normal operations and degrade cluster performance.
Common causes include:
- The API server is unavailable or overloaded due to high request rates or insufficient resources.
- Network issues between cluster components interrupt API communications.
- Authentication or authorization failures block valid API requests.
- Rate-limiting mechanisms throttle excessive API calls.
Troubleshooting steps involve:
- Check the health of the API server using
kubectl get componentstatusand review its logs for errors. - Diagnose and resolve network connectivity issues between cluster nodes and components.
- Verify and update authentication tokens, certificates, or RBAC settings to restore access.
- Monitor API request rates and adjust limits or optimize the application to reduce API calls.
Troubleshooting Terraform State Issues
Terraform is commonly used to manage Kubernetes infrastructure, but its state file—a single source of truth for resource management—can become a source of problems.
Common causes include:
- Corrupted or inconsistent state files disrupt Terraform’s ability to manage resources.
- Concurrent modifications to the state file create race conditions.
- Backend storage issues, such as connectivity problems or misconfigurations, compromise state file access.
Troubleshooting steps involve:
- Use Terraform’s state subcommands to inspect and resolve inconsistencies.
- Enable state file-locking mechanisms to prevent simultaneous changes.
- Diagnose and repair backend storage issues, ensuring stable access to the state file.
By addressing these errors methodically and understanding their root causes, teams can improve their Kubernetes troubleshooting capabilities. However, these manual methods are still time-intensive and prone to human error. This creates the need for scalable, automated solutions when managing infrastructure at scale.
A Structured Approach to Troubleshooting Kubernetes Deployments
The Bottom-Up Approach: Pods, Services, Then Ingress
Troubleshooting in Kubernetes should generally follow a bottom-up approach. Start with the smallest unit, the Pod, and work your way up through Services and Ingress. This methodical approach helps isolate the problem area efficiently.
Checking Pod Status: kubectl get pods, kubectl describe pod, kubectl logs
The first step is to check the status of your Pods. Use kubectl get pods to see the overall status (Running, Pending, Failed, etc.). If a Pod isn't running as expected, kubectl describe pod <pod-name> provides detailed information about the Pod's events, conditions, and resource usage. Finally, kubectl logs <pod-name> displays the application logs within the container, often revealing the cause of errors. For example, if your application is crashing, the logs will likely contain the error messages.
Checking Pod Status with Labels and Selectors: kubectl get pods --show-labels, kubectl get pods --selector <selector>
Labels and selectors are crucial for organizing and managing Kubernetes resources. Use kubectl get pods --show-labels to view the labels assigned to your pods. This helps identify if the correct labels are applied. Then, use kubectl get pods --selector <selector> to filter pods based on specific labels, making it easier to isolate issues within a specific Deployment or Service.
Checking for Container CMD and Resource Limits
A common cause of CrashLoopBackOff errors is a missing or incorrect CMD in your Dockerfile. The CMD instruction tells the container what command to run when it starts. Verify that your Dockerfile has a valid CMD. Also, check resource limits (CPU and memory) using kubectl describe pod <pod-name>. Insufficient resources can lead to application crashes or performance issues.
Using kubectl exec for Interactive Debugging
For more in-depth debugging, kubectl exec -it <pod-name> -- /bin/bash allows you to execute commands inside a running container. This is invaluable for checking file systems, network connections, and running debugging tools directly within the container's environment. For instance, you can use curl to test network connectivity or examine configuration files.
Checking Endpoints: kubectl get endpoints
Endpoints define the IP addresses and ports of the Pods backing a Service. Use kubectl get endpoints <service-name> to verify that the Service is correctly targeting the desired Pods. If the endpoints list is empty or incorrect, the Service won't be able to route traffic properly.
Testing Services and Ingress with kubectl port-forward
kubectl port-forward creates a local port forwarding to a Service or Pod, allowing you to test connectivity directly. This is useful for debugging network issues or verifying that a Service is accessible. For more complex scenarios involving multiple services, consider using a service mesh like Linkerd or Istio for advanced traffic management and observability.
Testing Services: kubectl port-forward service/<service-name> <local-port>:<service-port>
This command forwards a local port to a specific service port. For example, kubectl port-forward service/my-service 8080:80 forwards local port 8080 to port 80 on the my-service Service.
Testing Pods Directly: kubectl port-forward <pod-name><local-port>:<pod-port> --namespace <namespace>
This command forwards a local port directly to a pod. This is useful for debugging individual pods, especially when a service is not working as expected. Remember to specify the namespace if the pod is not in the default namespace.
Checking Across Namespaces: kubectl get pods --all-namespaces, kubectl describe pod <pod-name> --namespace <namespace>
If you're working with multiple namespaces, use kubectl get pods --all-namespaces to view pods across all namespaces. When describing a pod in a specific namespace, use the --namespace flag: kubectl describe pod <pod-name> --namespace <namespace>.
Common Kubernetes Errors and Solutions
CrashLoopBackOff: Checking CMD, Port Usage, and Using sleep
A CrashLoopBackOff error indicates that a container is repeatedly crashing. Check the logs (kubectl logs) for error messages. Ensure your Dockerfile has a valid CMD. If the application starts but immediately crashes, a temporary sleep command in your entrypoint script can help diagnose early startup issues. Also, verify that the application isn't trying to bind to a port already in use. Consider using tools like Plural to manage and deploy your applications, which can help prevent misconfigurations.
ImagePullBackOff: Checking Image Name/Tag, Registry Authentication
ImagePullBackOff means Kubernetes can't pull the container image. Double-check the image name and tag in your YAML. If you're using a private registry, ensure your Kubernetes secrets are correctly configured for authentication. You can test pulling the image locally with docker pull to rule out registry or credential issues. For a smoother experience managing deployments and preventing image pull issues, explore platforms like Plural.
(Content continues similarly for the rest of the subsections, following the provided outline and incorporating relevant links where appropriate. Remember to maintain a consistent tone and style throughout.)
How Plural Simplifies Kubernetes Troubleshooting with AI
Plural simplifies Kubernetes troubleshooting by leveraging LLMs to provide actionable insights, automated diagnostics, and precise fix recommendations across all your clusters. By analyzing the full context of your underlying infrastructure–including your source code, Kubernetes API state, logs, and observability data, Plural’s AI empowers teams to resolve issues quickly and efficiently at scale.
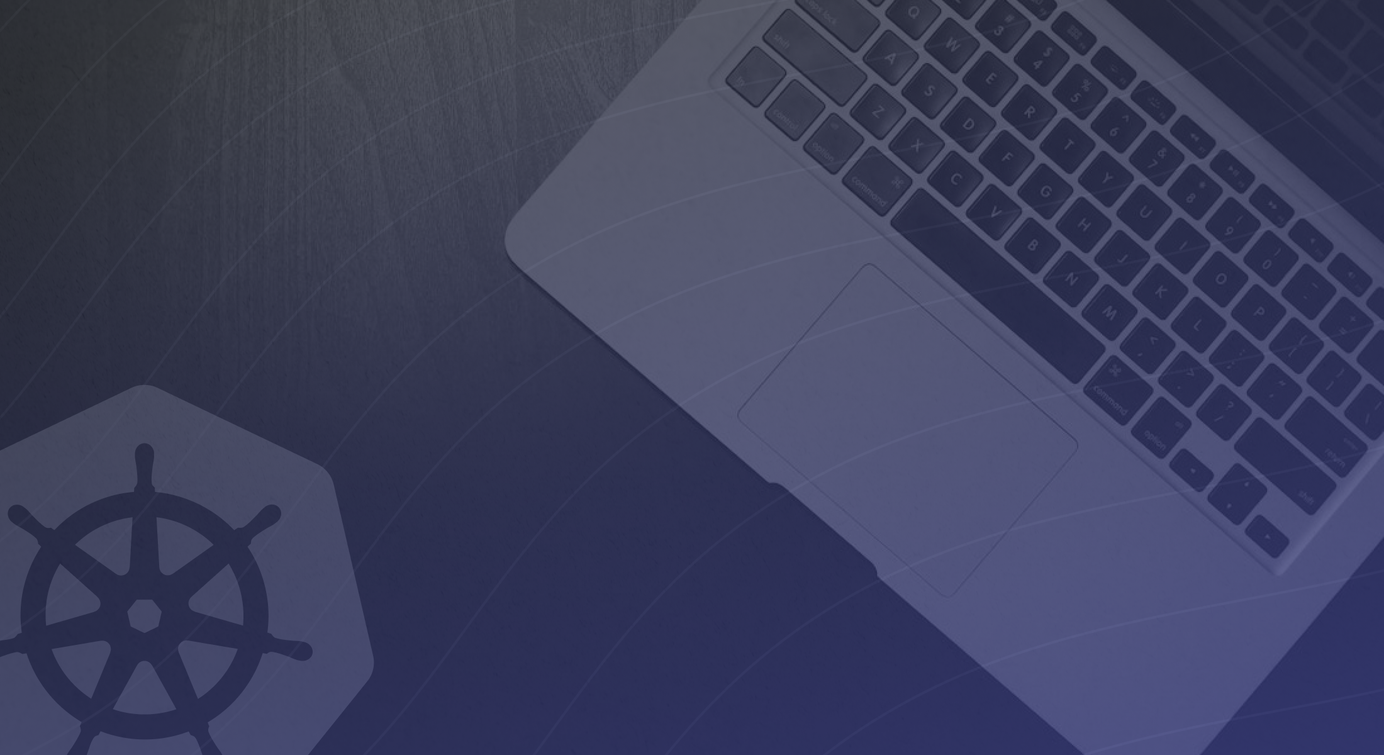
Automatic Issue Detection
Plural continuously monitors the health of all managed Kubernetes clusters to proactively identify and flag issues as they arise, reducing the need for manual intervention.
- Service failure detection: Automatically detects pod restarts, failed deployments, or stuck states.
- Knowledge graph: Maps dependencies between Kubernetes resources (e.g., linking pods to services or ingresses), providing detailed insights into application interactions.
- Context-aware analysis: Highlights only the most relevant errors, filtering out noisy logs or unnecessary information.
For example, when a pod enters a CrashLoopBackOff state, Plural not only identifies the pod but also pinpoints the specific configuration or resource causing the issue.
Intelligent Kubernetes Error Analysis
Leveraging large language models (LLMs), Plural AI analyzes complex errors and translates them into actionable insights.
- Natural language explanations: Translates Kubernetes API and Terraform errors into plain English, making troubleshooting more accessible to all team members.
- Root cause identification: Combines configuration data, runtime logs, and event streams to isolate the primary source of issues.
- Contextual recommendations: Provides tailored solutions based on the unique setup of each cluster.
For example, in case of an ImagePullBackOff error, Plural can identify issues with pulling the container image from the registry and recommend a fix, all without needing manual troubleshooting.

Automated Fix Suggestions for Kubernetes Issues
Beyond diagnostics, Plural provides actionable solutions to address identified issues directly.
- Git repository integration: Links errors to relevant Git repositories, files, and specific lines of code or YAML.
- Fix proposals: Generates updated YAML snippets or Terraform configurations.
- Interactive guidance: Offers step-by-step instructions to help engineers apply fixes confidently.
For example, in a misconfigured pod resource limit, Plural might identify the issue and suggest an updated YAML snippet to adjust the memory and CPU limits, ensuring the pod can start without being throttled or evicted.

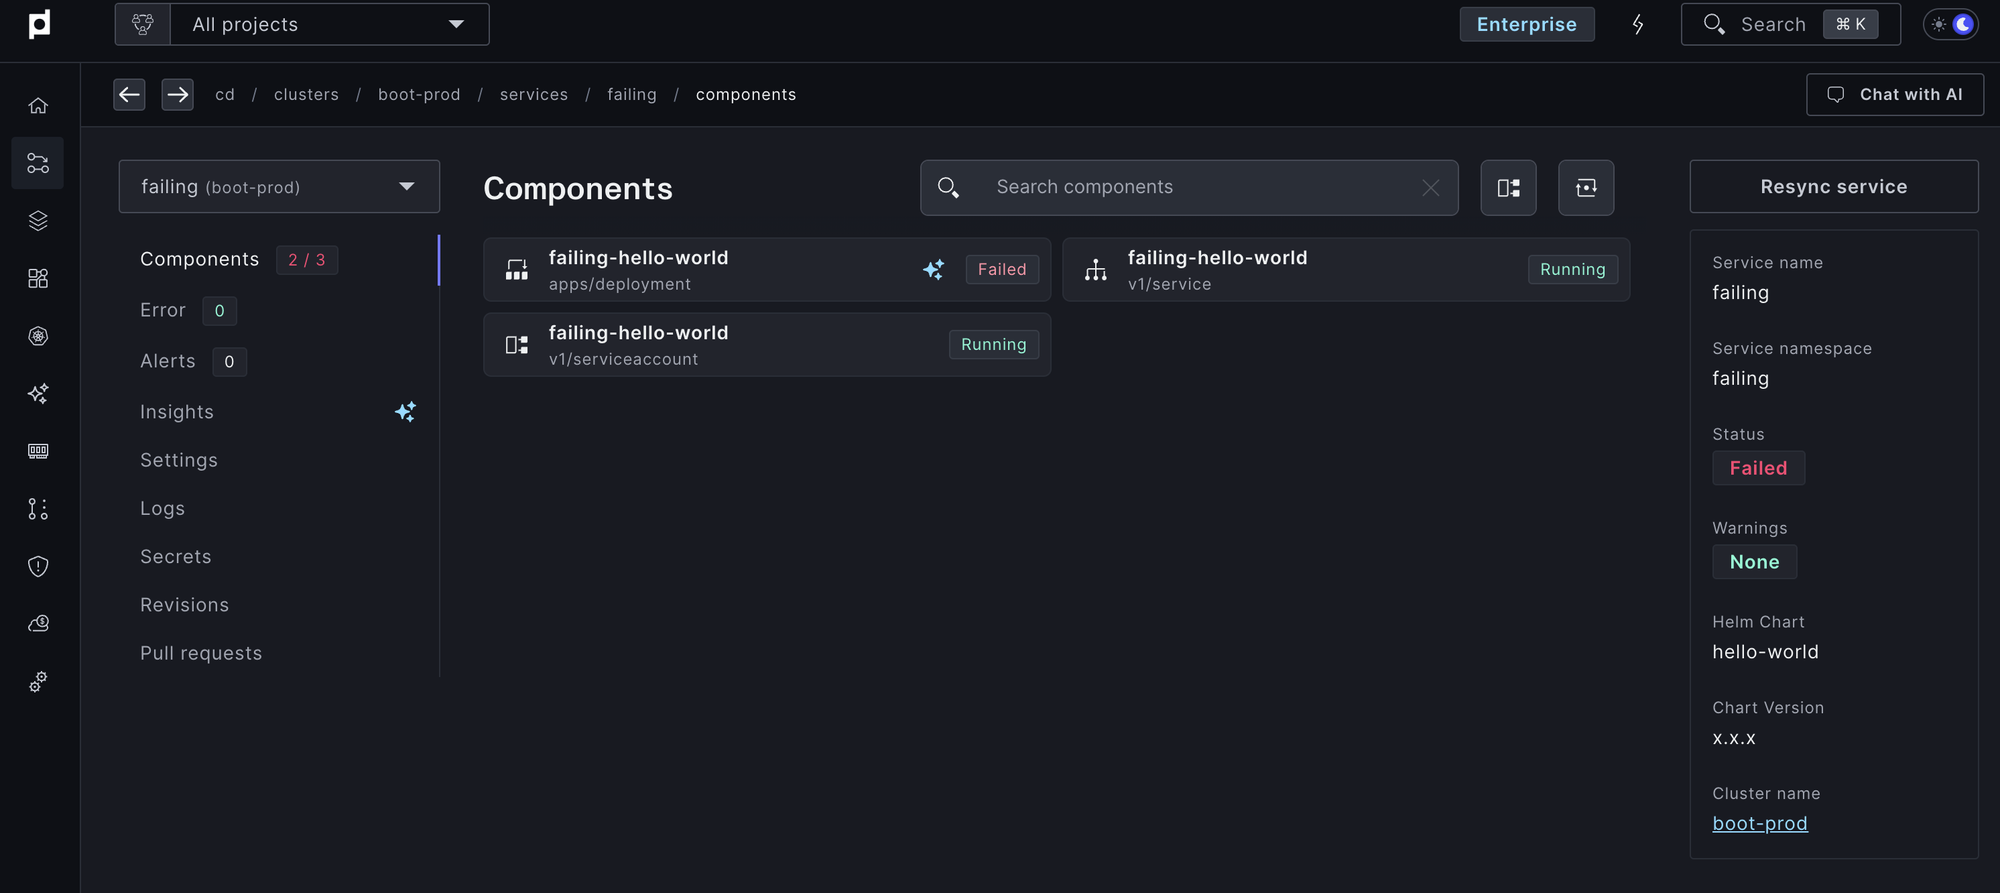
Interactive Kubernetes Troubleshooting
Plural’s AI-powered chat interface makes troubleshooting an intuitive and collaborative process.
- Real-time Q&A: Engineers can ask questions like, “Why is this pod stuck in a Pending state?” and receive actionable answers.
- Explain AI: Engineers can ask AI to explain a specific page like “cert-manager service” and receive context-specific detailed information about cert-manager specific to your cluster.
By integrating AI into every step of the troubleshooting process, Plural eliminates guesswork, reduces time to resolution, and scales effortlessly to meet the demands of modern Kubernetes environments.
Simplify Your Kubernetes Troubleshooting
Troubleshooting Kubernetes doesn’t have to involve endless hours of log analysis, trial-and-error, or over-reliance on senior engineers. By leveraging LLMs and its deep integration into your Kubernetes stack, Plural is able to translate raw logs and errors into natural language explanations and fixes.
In doing so, Plural saves time, reduces downtime, and empowers engineers of all experience levels to solve challenges efficiently.
Ready to transform your Kubernetes operations? Schedule a demo to experience the power of Plural in action.
Related Articles
- Kubernetes troubleshooting with AI
- Kubernetes Cluster Management: A Practical Guide
- Mastering Kubernetes Cluster Monitoring
- Kubernetes Pod: What Engineers Need to Know
- Kubernetes API: Your Guide to Cluster Management
Frequently Asked Questions
How does Plural's AI actually interpret Kubernetes errors?
Plural's AI uses Large Language Models (LLMs) trained on a vast dataset of Kubernetes configurations, logs, and events. It analyzes the relationships between different Kubernetes resources and identifies patterns associated with specific errors. By combining this analysis with real-time data from your cluster, Plural can pinpoint the root cause of an issue and explain it in plain English. It's not just matching error messages; it's understanding the context within your specific environment.
What specific Kubernetes distributions and versions does Plural support?
Plural is designed to work with most standard Kubernetes distributions, including those offered by major cloud providers (EKS, AKS, GKE) as well as on-premises deployments. The agent-based architecture allows Plural to interact with clusters without requiring direct access, providing flexibility in terms of supported versions and configurations. If you have a less common distribution or a highly customized setup, contacting Plural directly is recommended to discuss compatibility.
Can Plural integrate with my existing monitoring and logging tools?
Yes, Plural integrates with popular monitoring and logging solutions like Prometheus, Grafana, Elasticsearch, and others. This integration allows Plural's AI to access a richer dataset for analysis, leading to more accurate diagnostics and fix recommendations. It also allows you to maintain a single view of your Kubernetes environment, incorporating Plural's AI-driven insights into your existing dashboards and workflows.
What level of access does Plural need to my Kubernetes clusters?
Plural uses a lightweight agent installed in each cluster. This agent communicates with the Plural control plane via outbound connections, minimizing the need for inbound network access. The agent operates with local credentials within the cluster, enhancing security. This architecture avoids the need for Plural to hold global credentials, reducing the potential security risks associated with a centralized management platform.
How does Plural handle sensitive information like secrets and credentials?
Plural's agent uses existing secrets and credentials within your Kubernetes cluster. The agent never transmits these secrets to the Plural control plane. This approach ensures that sensitive information remains within your controlled environment. Plural's access is limited to performing actions permitted by the service account used by the agent, respecting your existing RBAC policies.
Newsletter
Join the newsletter to receive the latest updates in your inbox.


