June Product Update
🚀 What's New in Plural
🤖 MCP—AI-Powered Operations in Your Flow Chat
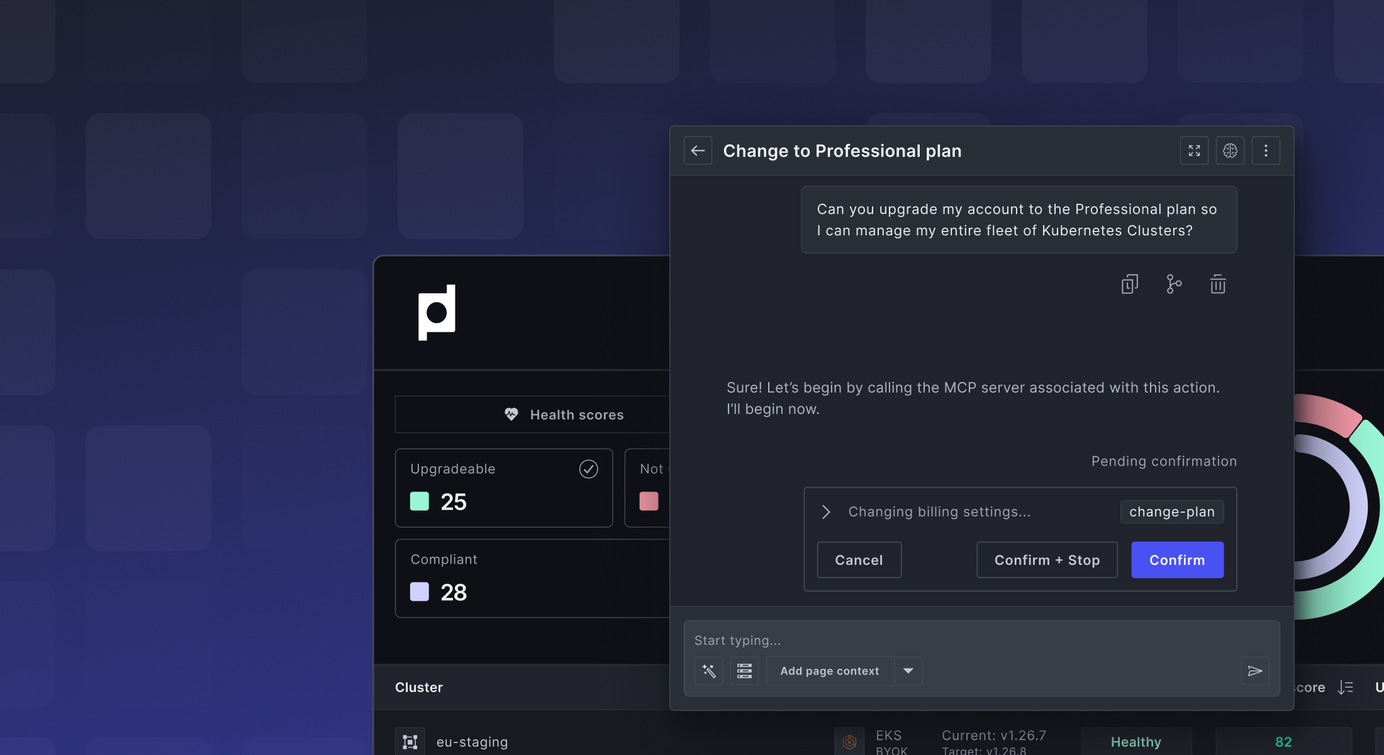
Model Context Protocol (MCP) brings intelligent operational capabilities directly into your Plural Flows. Instead of switching between multiple tools and interfaces, you can now handle infrastructure tasks, query logs, and manage operations through natural conversation in Flow Chat.
Available now in Plural Flows, MCP servers let you:
- Query alerts and logs with commands like "There are alerts firing, can you list and explain them?" or "Show me the logs associated with that alert."
- Handle operational tasks through conversational interfaces with full audit logging and optional approval workflows.
- Access infrastructure context without leaving your Flow—the AI understands your services, deployments, and current state.
Execute actions safely with confirmation prompts for sensitive operations before any changes are made.
Enterprise-grade security ensures every MCP interaction is authenticated, authorized, and logged. The same permissions that govern your Flow access control what MCP operations you can perform.
Perfect for platform teams who want to streamline operational workflows while maintaining security and auditability. No more context switching between dashboards, just ask your Flow Chat what you need to know.
📊 Updated Operational Console—Intelligent Infrastructure Health at a Glance
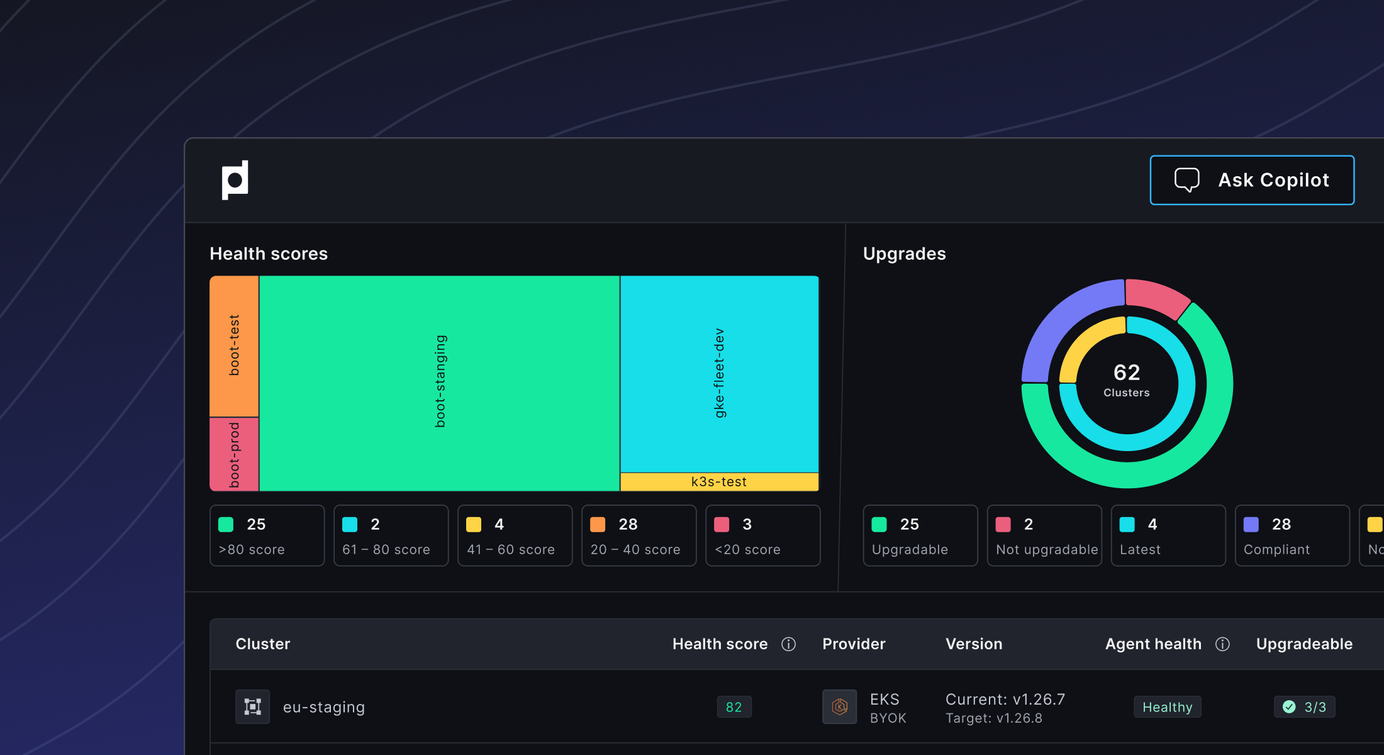
The enhanced operational console transforms raw Kubernetes data into actionable insights, helping you identify and resolve issues before they impact your applications.
Key features:
- Health scores provide instant visibility into cluster and service health with intelligent scoring algorithms that consider resource utilization, error rates, and operational metrics.
- Failing node discovery automatically identifies problematic nodes and surfaces root causes, from resource exhaustion to configuration drift.
- Misconfiguration prioritization uses AI-driven analysis to rank cluster misconfigurations by impact severity, helping you focus on the changes that matter most.
Smart operational intelligence replaces manual monitoring dashboard correlation. Instead of hunting through metrics across multiple screens, get a unified view of what needs attention and why it matters to your infrastructure stability.
🌳 Tree View: Visual Infrastructure Relationships That Actually Work
Your monitoring dashboard shows 66 out of 67 services as healthy. But your application is down, and alerts are firing. Which specific component is actually broken?
Tree View solves this fundamental Kubernetes problem by providing a visual representation of your complete resource hierarchy—showing exactly which resources created which, their current health status, and where failures are occurring.
The technical architecture tackles Kubernetes API limitations:
- Real-time SQLite caching streams changes from Kubernetes Watch APIs for every resource type, including custom resources.
- Recursive query engine uses SQL's WITH RECURSIVE syntax to reconstruct complete ownership hierarchies in a single query.
- Efficient relationship mapping stores minimal metadata for fast tree reconstruction.
- AI-enhanced infrastructure analysis provides crucial context for intelligent troubleshooting with custom operators and CRDs.
Visual hierarchy debugging replaces the forensic investigation of correlating multiple kubectl outputs. Instead of running commands across terminal windows, you instantly see which specific component is failing and how it relates to your top-level services.
📈 Enhanced Monitoring: Log Aggregation and Prometheus Now Supported by Default
Unified observability just got simpler. Log aggregation is now natively supported in Prometheus deployments, eliminating the need for separate log management infrastructure in many use cases.
This enhancement streamlines your monitoring stack by consolidating logs and metrics in a single system, reducing operational complexity and improving query performance for correlated troubleshooting.
🔧 Additional Platform Enhancements
Expanded data platform support: Airflow is now onboarded on AWS and Dagster on GCP, bringing first-class data orchestration to more cloud environments.
New data store operators: Enhanced operator support for Elasticsearch and PostgreSQL simplifies database deployment and management across your infrastructure.
Flow chat alerts: Critical alerts now surface directly in Flow chats, keeping your team informed without leaving their operational workspace.
AI-Powered tree insights: Advanced AI analysis now probes the entire resource tree hierarchy, generating deeper insights for complex infrastructure troubleshooting scenarios.
🏢 Company Updates
- We’ll be attending AWS Summit NYC on July 16th at the Javits Center. Let us know if you plan on attending!
- NYC Kubernetes Meetup. Thanks to everyone who joined our container isolation session last week. See you at the next one!
🚀 Try Plural Today
Ready to experience MCP-powered admin workflows, intelligent operational insights, visual infrastructure debugging, and managed Kubernetes with built-in observability?
Newsletter
Join the newsletter to receive the latest updates in your inbox.


