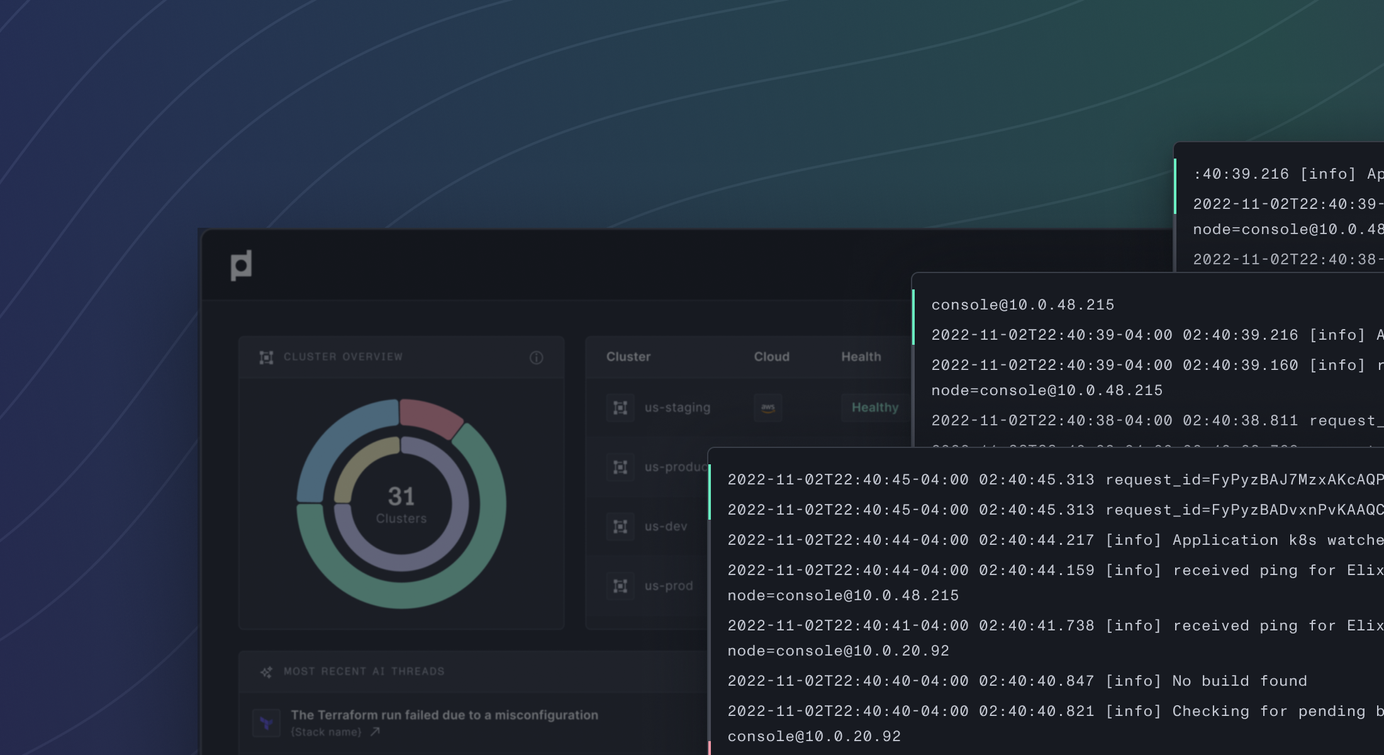
Logs Aggregation in Plural: One Console, All Your Logs
Plural now offers built-in log aggregation that lets you view and search logs directly in the Plural console. You can query logs at both the service and cluster level, with proper access controls in place.
Table of Contents
The Problem with Kubernetes Logs
Most teams running Kubernetes face a common headache: logs are scattered across clusters, services, and tools. Platform teams spend too much time setting up log aggregation and governance, while developers waste hours jumping between
different interfaces just to debug issues.
The problem gets worse at scale. As you add more clusters and services, you end
up with a maze of logging tools and access controls. And when something breaks,
finding the right logs becomes a frustrating treasure hunt.
What's New
Plural now offers built-in log aggregation that lets you view and search logs
directly in the Plural console. You can query logs at both the service and
cluster level, with proper access controls in place.
Key Features
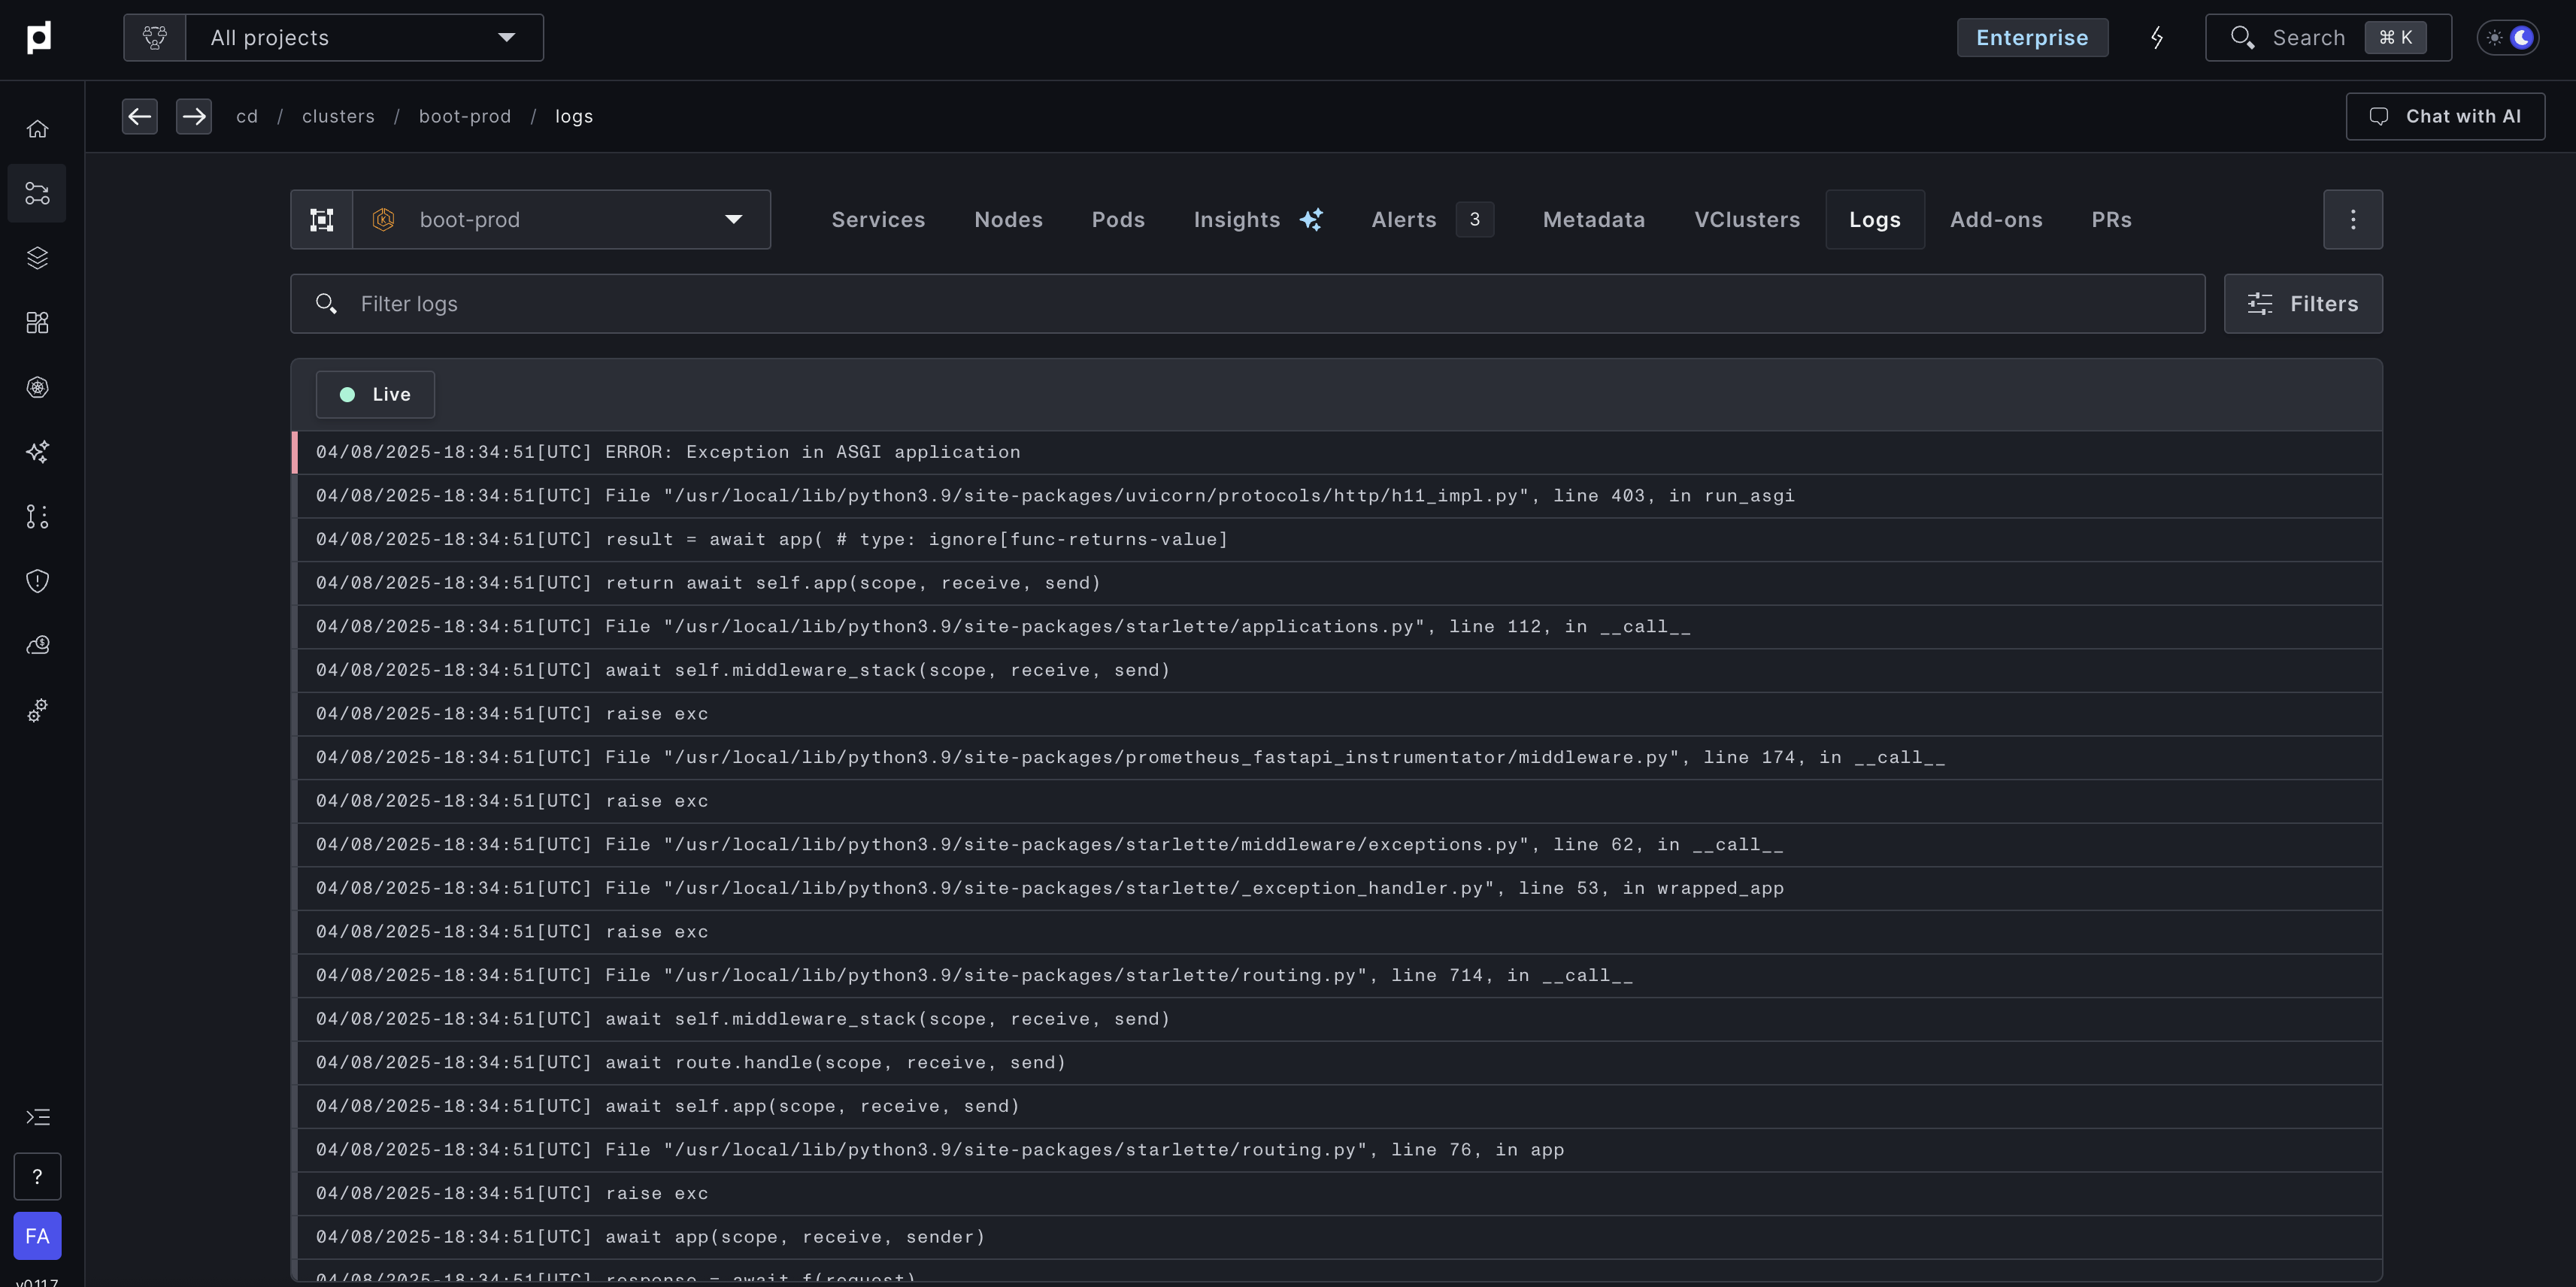
Service-Level Logs
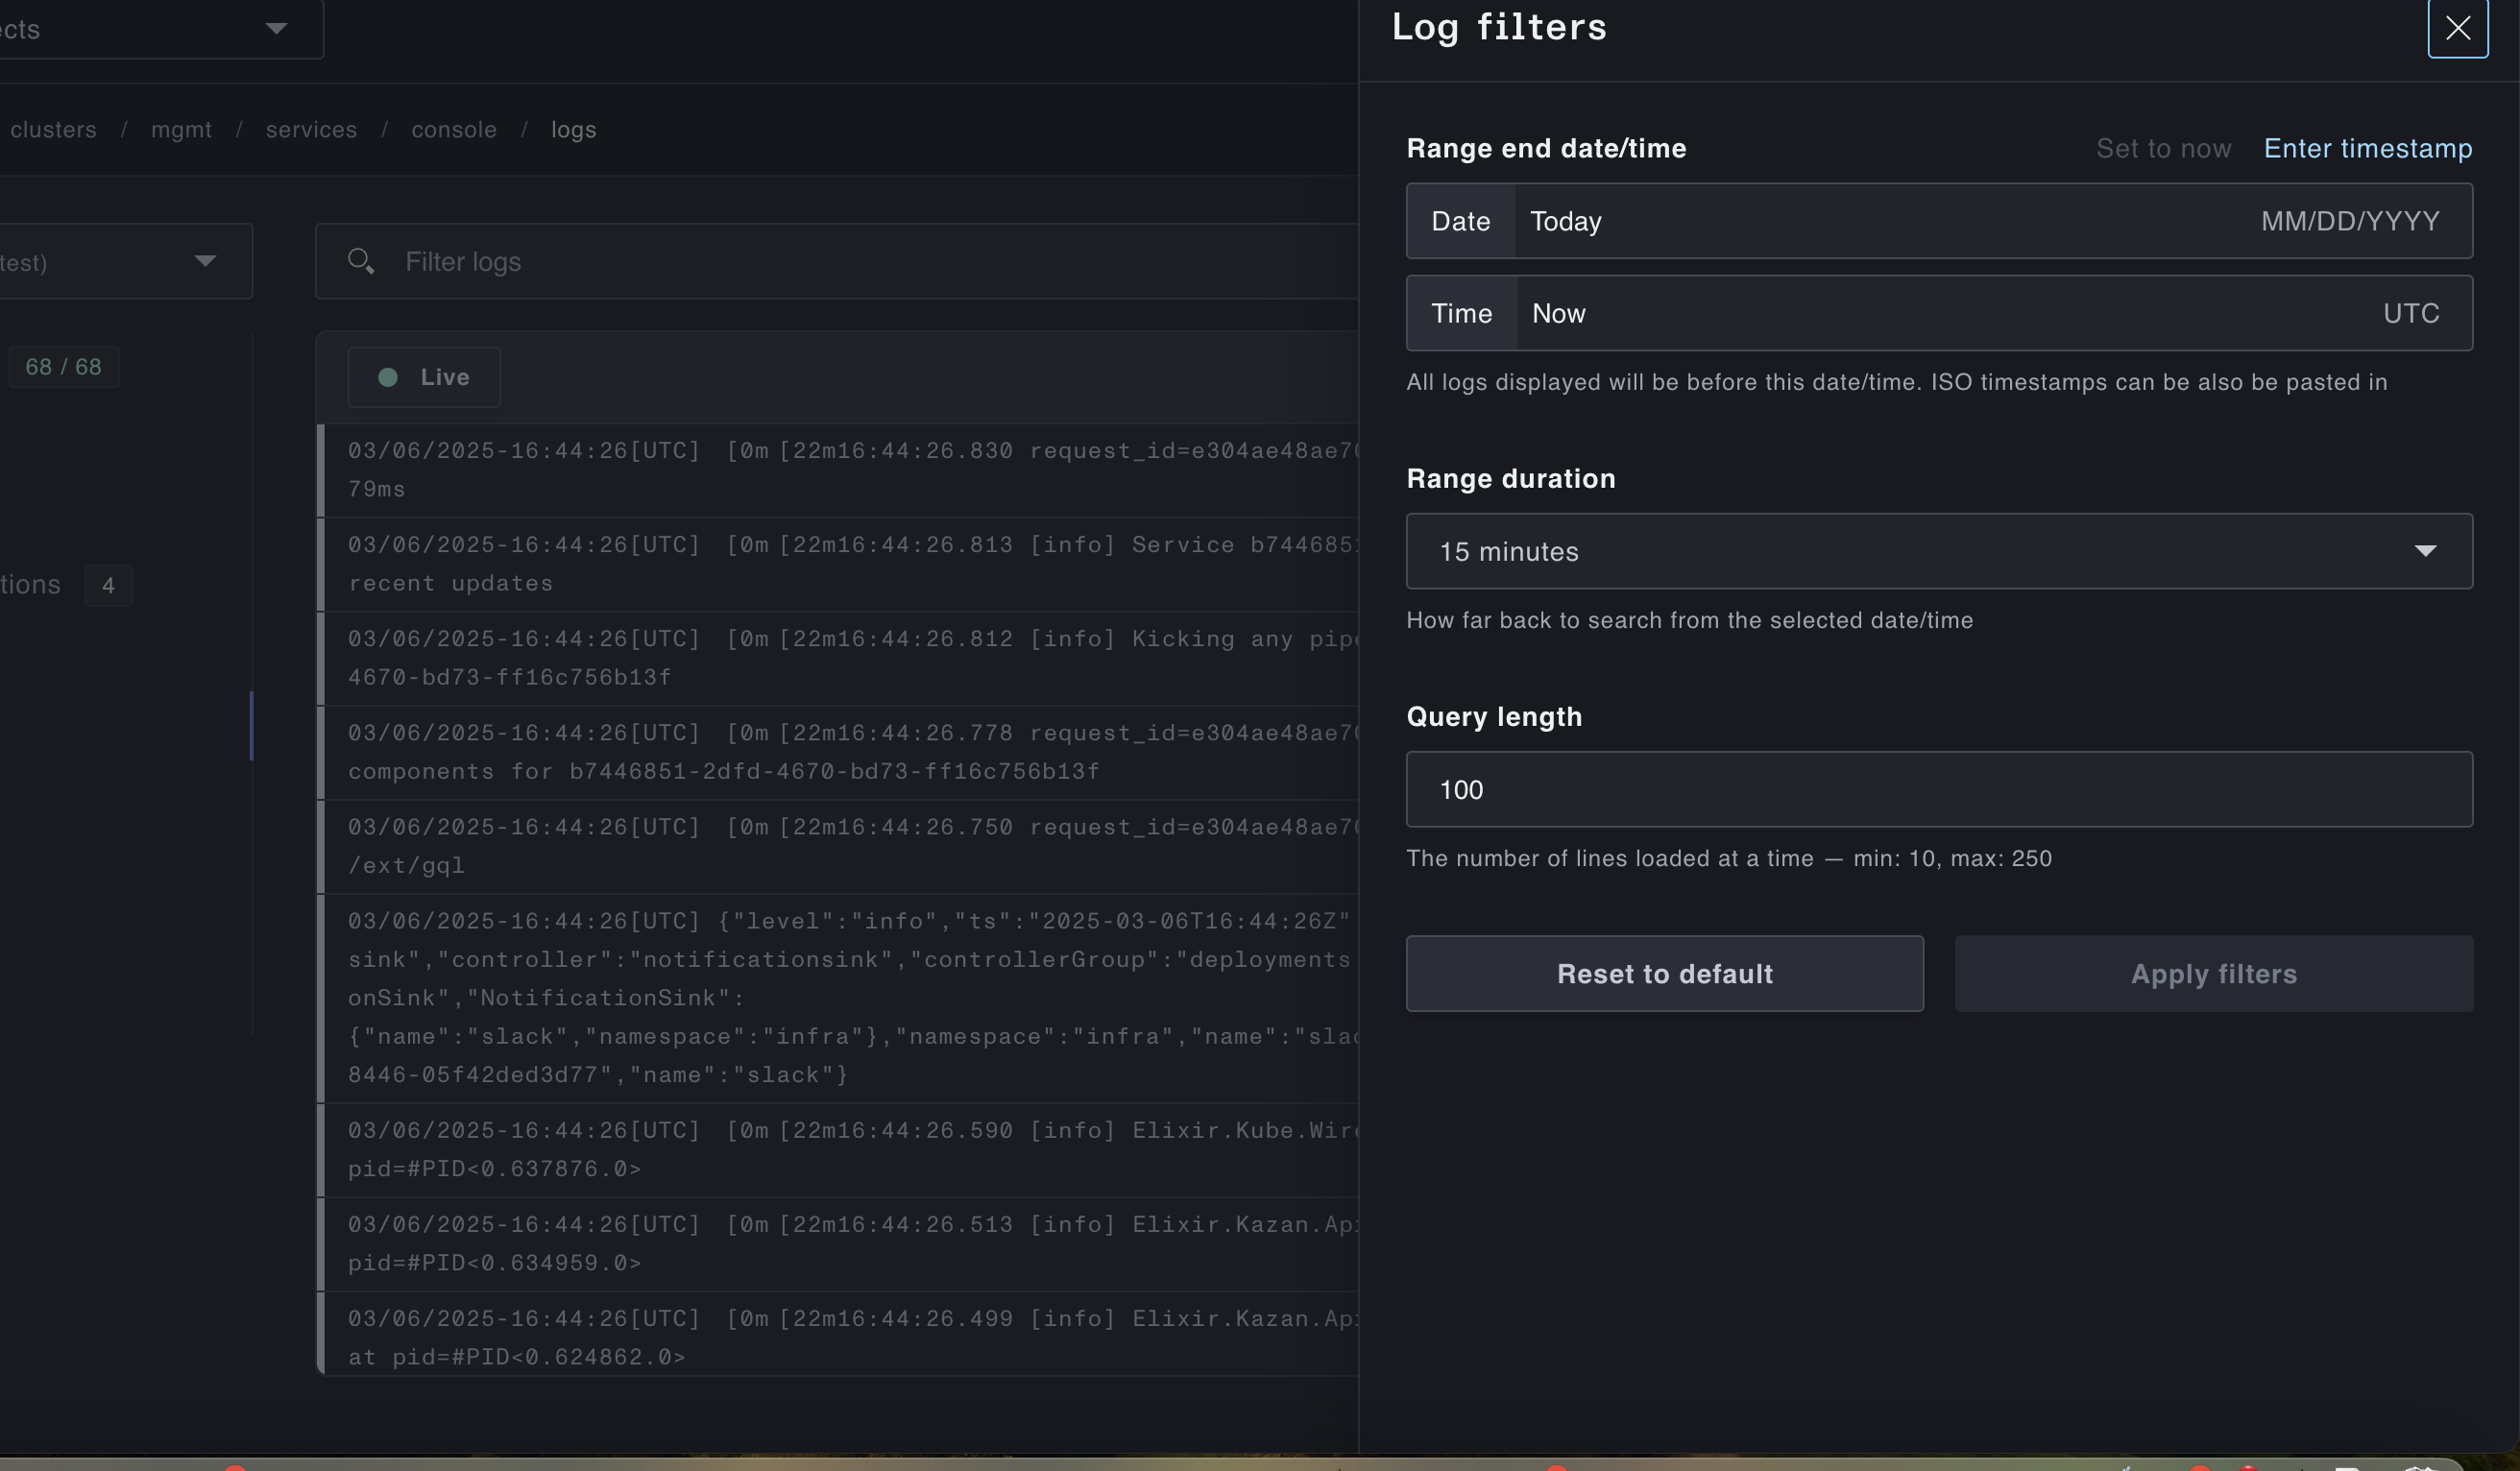
Every Plural service now has a Logs tab where you can:
- Full-text search across your logs
- Filter by time and other attributes
- View log context to see what happened before and after an event
- See all the facets associated with your logs and filter on them
Cluster-Level Logs
If you have cluster-level read permissions, you can also view logs across your
entire cluster. This is particularly useful for platform teams and Kubernetes
administrators who need broader visibility.
Built-in Governance
One of the key advantages of our logging solution is that it's already
integrated with Plural's permission model. The system automatically extracts
logs that map to the pods in your service, ensuring users only see logs they're
authorized to access. This governance - which typically requires expensive
enterprise solutions - comes standard with Plural.
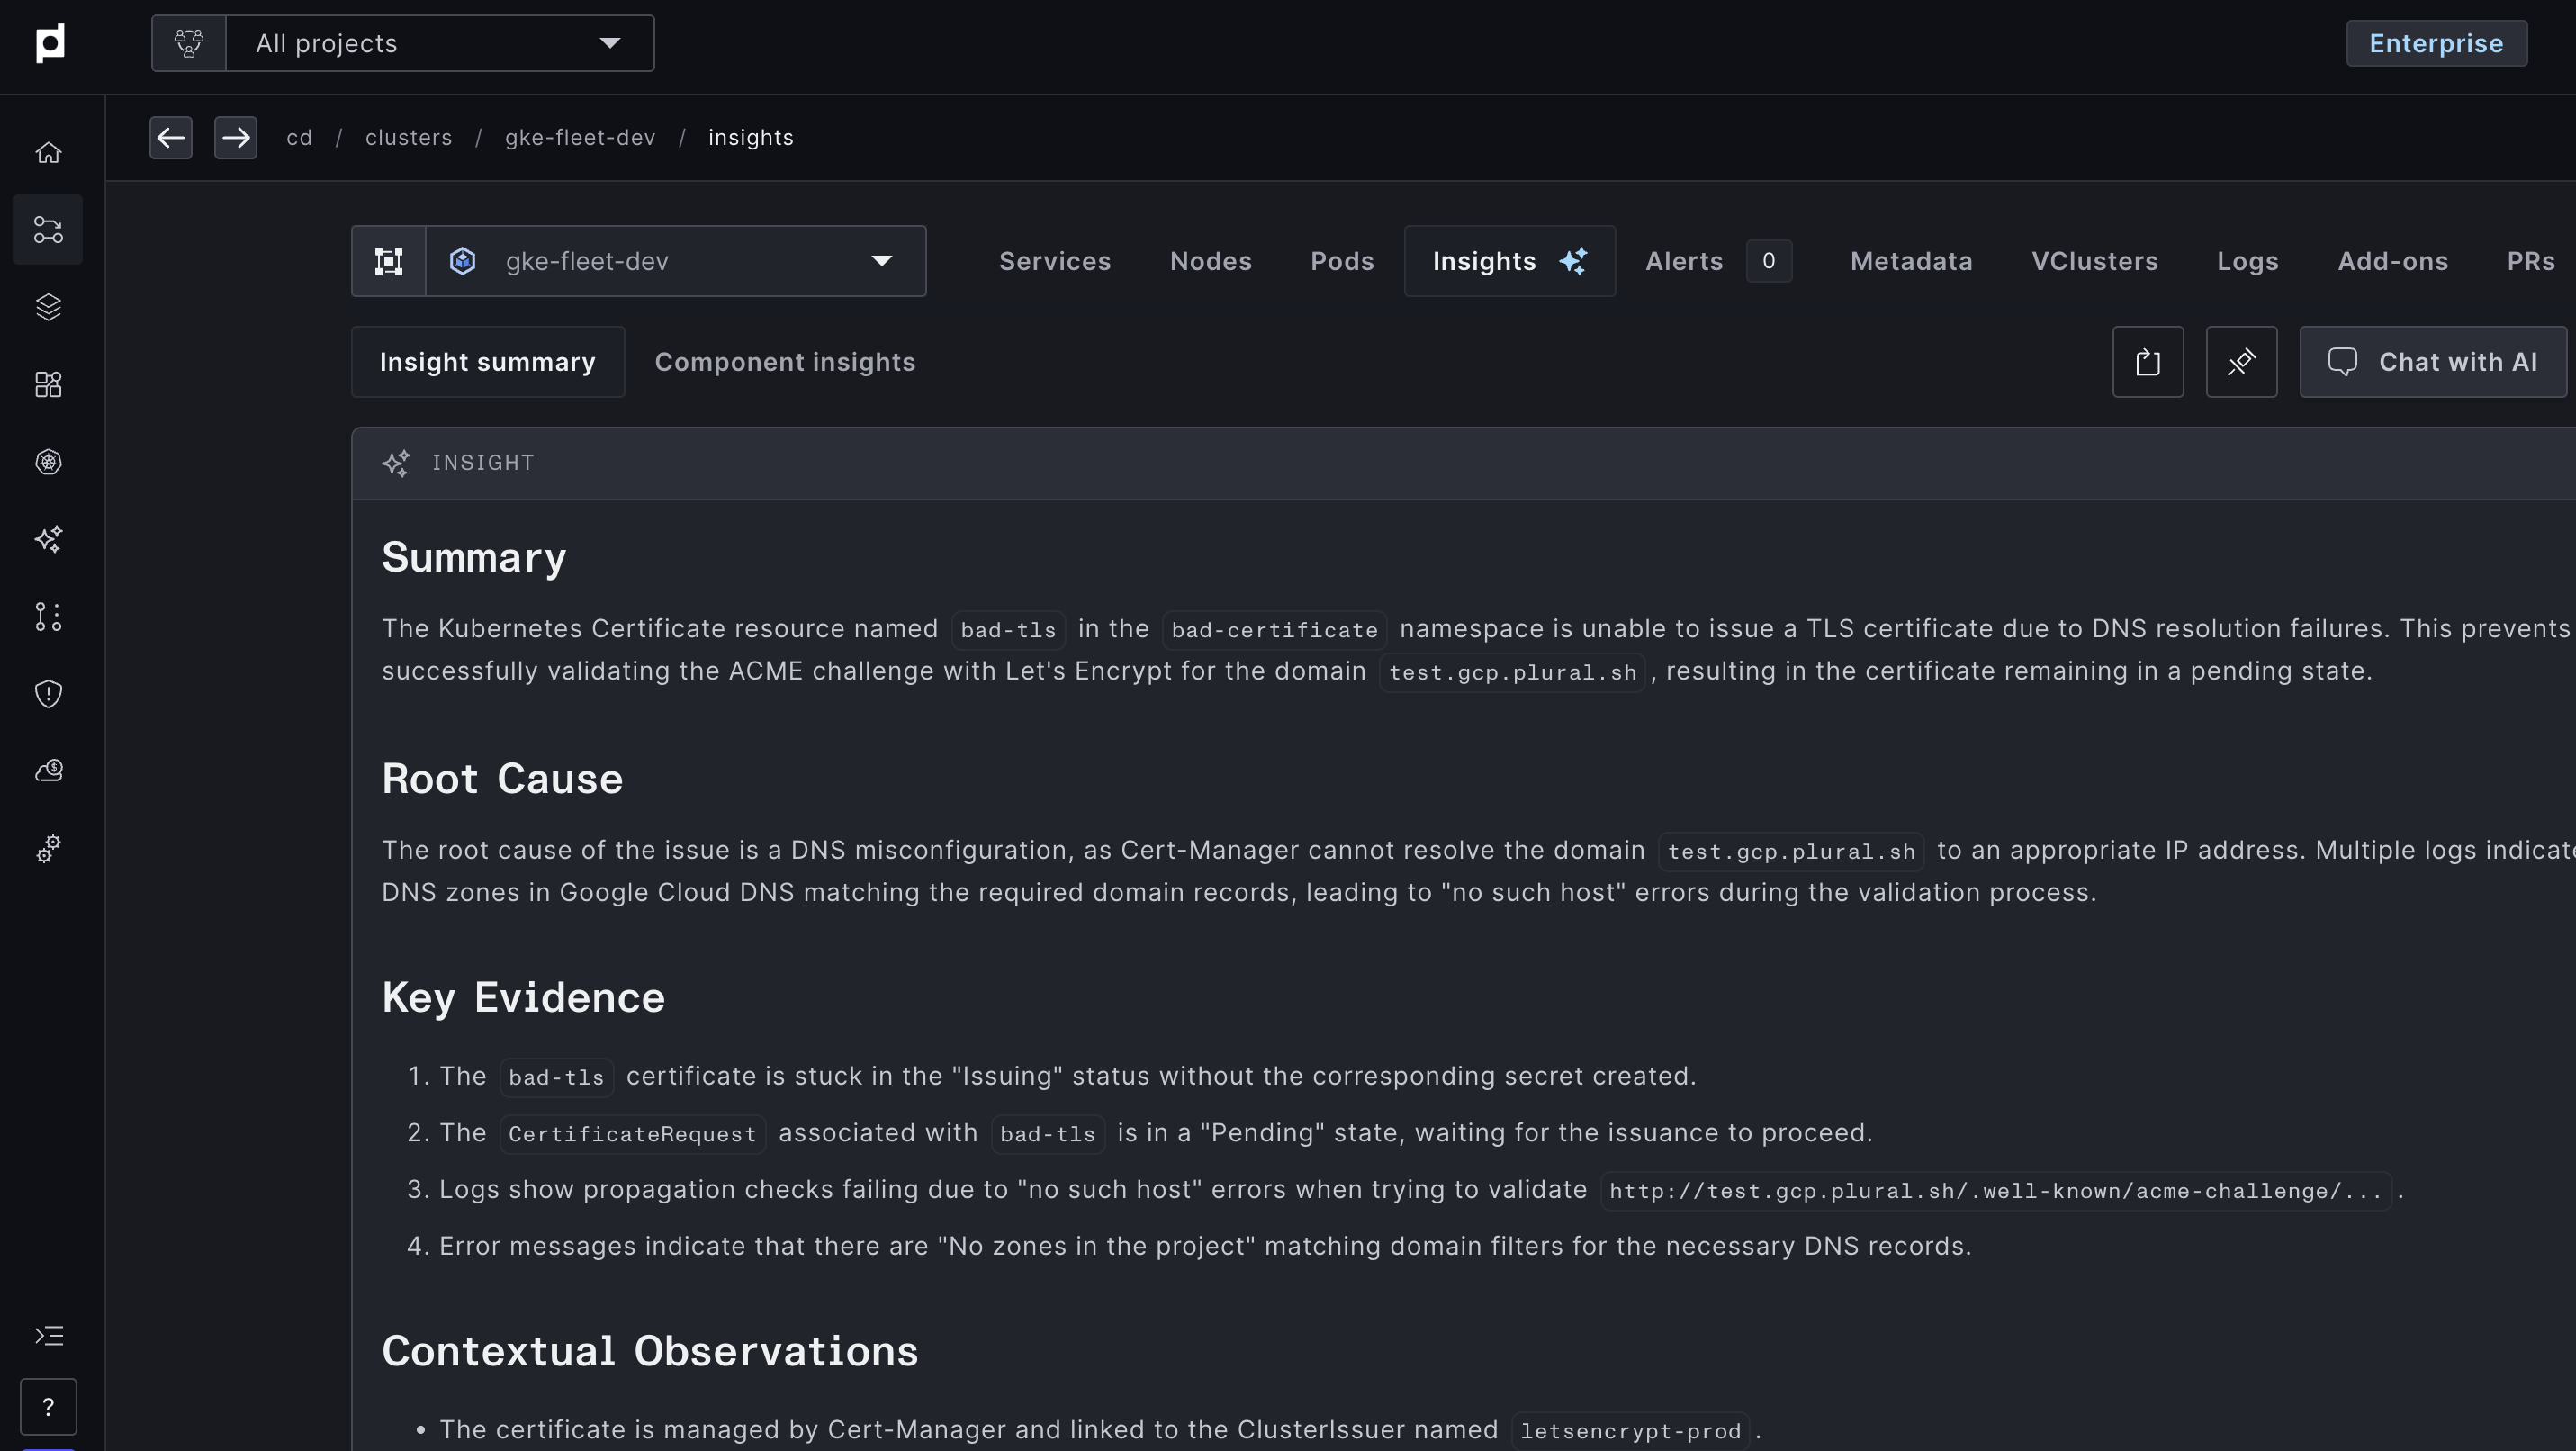
AI-Powered Troubleshooting
When issues arise in your clusters, Plural can now use log data to help identify
root causes. For example:
- For certificate provisioning issues, we'll automatically search logs from
cert-manager and external-dns - For application errors, we'll identify the specific endpoints and code causing
issues - All findings include the actual log evidence used to reach conclusions
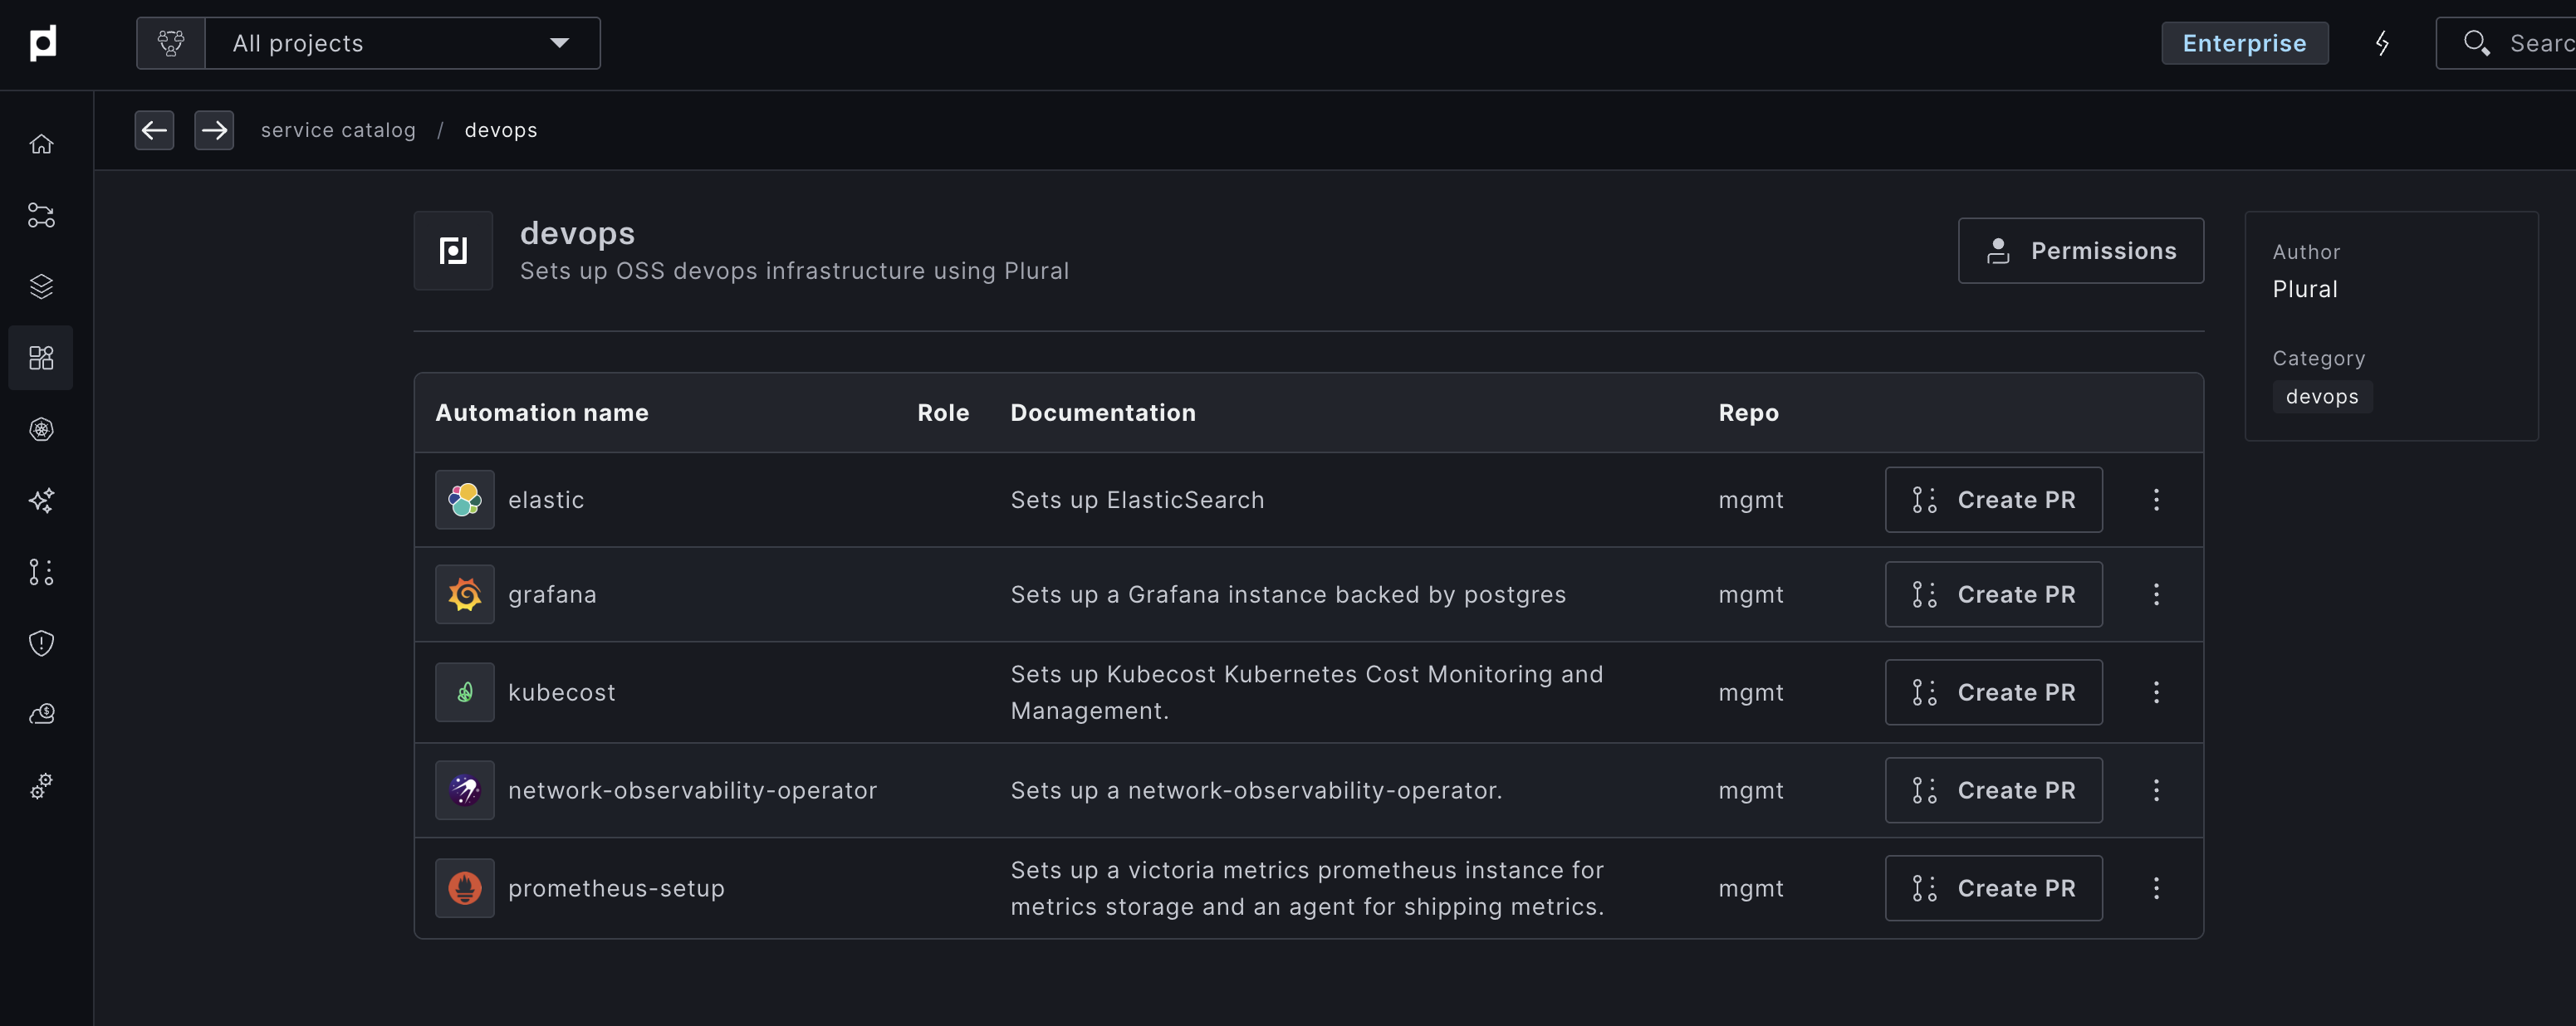
Getting Started
To get set up with logs aggregation, we recommend that you use our Service Catalog:
- Go to Service Catalog → DevOps in Plural
- Select the
elastictemplate - This will set up:
- An fully managed Elasticsearch cluster using the ECK operator. The operator handles common operations like adding/removing nodes, resizing volumes, and managing the Elasticsearch cluster
- Kibana for advanced log visualization
- Logstash deployed to all clusters via a Plural global service
If you have your own Elasticsearch instance, the connection can be configured via CRD.
Try It Out
Ready to get started with unified logging?
Book a demo to try Plural.
For detailed setup instructions, check out our log aggregation documentation.

Newsletter
Join the newsletter to receive the latest updates in your inbox.


